Graduates from each annual graduating class who are found working in Ohio over time, from one to five years following graduation. Excludes individuals working for a federal employer or self-employed.
Median earnings of those graduates found working in Ohio over time, from one to five years following graduation. Excludes individuals working for a federal employer or self-employed.
Graduates found working in Ohio by most common industries, as defined by the 2-digit NAICS code reported by the employer, two quarters following graduation.
Undergraduate students enrolled during any term in the given school year, excluding students also enrolled in high school. The 2010-11 school year includes summer 2010, autumn 2010, winter 2011, and spring 2011.
Undergraduates students who are enrolled for the first time in any higher education institution as an undergraduate.
Undergraduate students in the Entering Cohort who received college course credit from a public Ohio institution of higher education while enrolled in high school. Includes dual enrollment and college credit plus.
Undergraduate students in the Entering Cohort who enroll in one or more developmental courses in the first year of enrollment.
Undergraduate students who are enrolled in at least one course for credit for the first time at an institution who are enrolled in the same institution autumn of the entering year and autumn one year later.
Undergraduate students who are enrolled in at least one course for credit for the first time at an institution who completed a certificate or a degree within six years. If a student earned multiple degrees during this time, only the highest level is represented.
Race/ethnicity of students enrolled during any term in the given school year. Includes undergraduate and high school students.
Gender of students enrolled during any term in the given school year. Includes undergraduate and high school students.
Age of students enrolled during any term in the given school year. Includes undergraduate and high school students.
The Ohio Education Research Center, with the Central Ohio Compact Dashboard Steering Committee, developed this in-depth report, which focuses on the Central Ohio region, analyzes the academic performance of Ohio two-year college students transferring to in-state, public, four-year universities. The report highlights the performance of students who transferred from Columbus State Community College (CSCC) to The Ohio State University (OSU). Other two-year colleges in Central Ohio have relatively small numbers of transfer students, so their data were too small to include (due to privacy considerations). Key findings of this research are highlighted, including demographics and graduation outcomes.
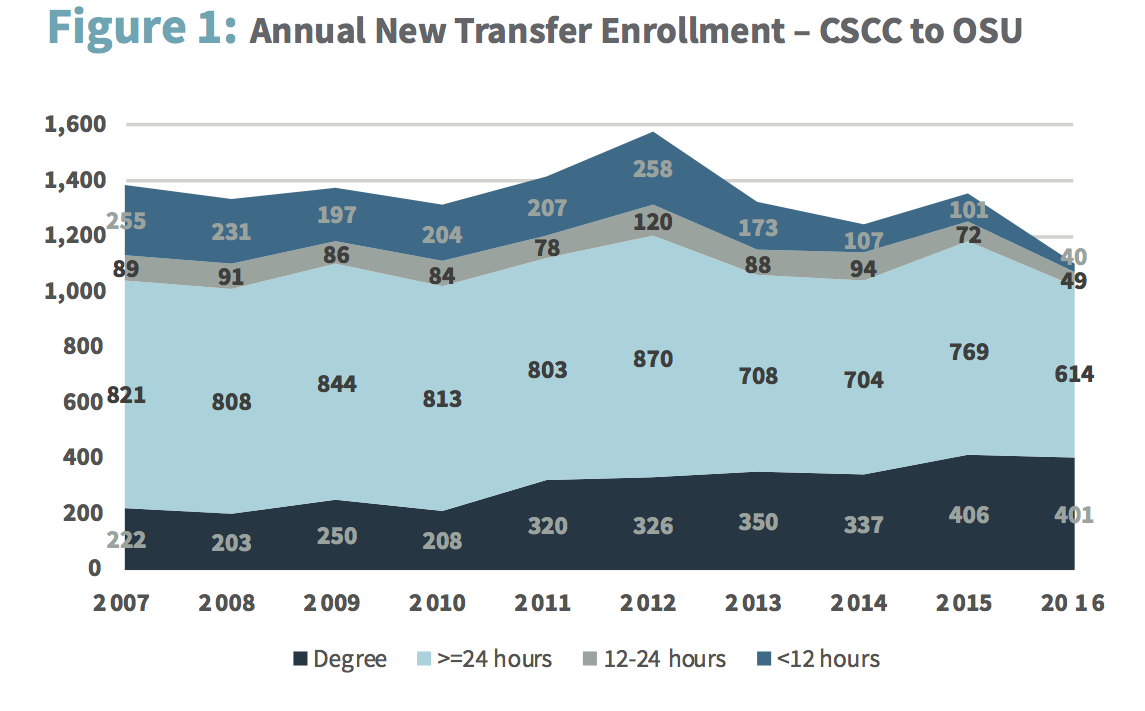
The rate of incoming students at OSU with prior earned credit from CSCC has changed over time. Other public four-year universities have experienced similar trends. Most transfer students arrive at OSU with more than 24 credit hours, but without an associate’s degree or transfer module. However, the number of students transferring from CSCC with these credentials has been increasing, approximately doubling between 2007 and 2016. During this time period, the number of transfer students having 24 credit or less decreased by 74% as well.
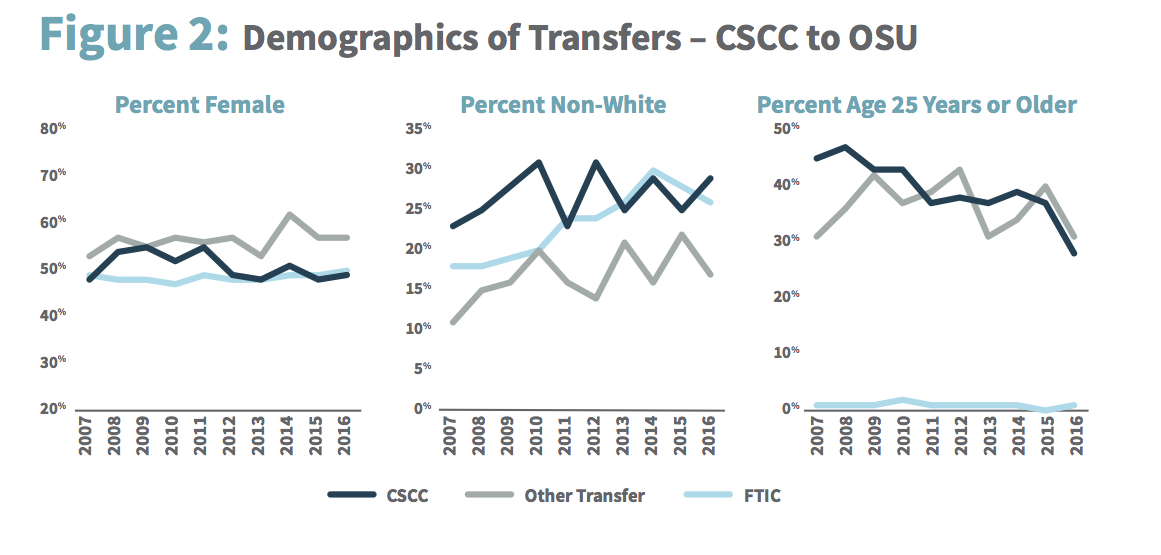
The demographics of OSU transfer students who earned a degree or certificate from an Ohio two-year college, from CSCC, and who are enrolled as a first time in college undergraduate (FTIC) are shown in Figure 2. Observations include:
The Central Ohio Compact dashboard data analysis is done primarily using data sources available through the Ohio Longitudinal Data Archive (OLDA)
Please note for all graphs on this website, groups of less than 10 individuals are redacted to protect possible re-identification.
Higher Education Information System (HEI) – detailed student-level data collected by the Ohio Department of Higher Education. Includes all students who enroll in public higher education in Ohio.
Unemployment Insurance (UI) Wages and Quarterly Census of Employment and Wages (QCEW) – employee-level employment and wage data and firm-level industry data reported each calendar quarter by the Ohio Department of Job and Family Services (ODJFS). Includes wages for all employees within the state of Ohio whose employers are required to file with the unemployment insurance tax system. Excludes workers outside of Ohio, Federal employees, and the self-employed.
Ohio Technical Centers – detailed student-level data collected by the Ohio Department of Higher Education. Includes all individuals who participate in Ohio Technical Center programs in Ohio.
These data sources can be joined at the individual level using a unique identifier. By joining these data sets, we can follow an individual who enrolls in an Ohio public institution of higher education through enrollment to graduation and then to employment in Ohio.
Ohio Department of Education Report Card data Power User Reports - publicly available detailed data about each school district and community school in Ohio, as well as each high school-level career-technical education program.
The OLDA is a project of the Ohio Education Research Center (oerc.osu.edu) and provides researchers with centralized access to administrative data. The OLDA is managed by The Ohio State University's Center for Human Resource Research (chrr.osu.edu) in collaboration with Ohio's state workforce and education agencies (ohioanalytics.gov), with those agencies providing oversight and funding. For information on OLDA sponsors, see http://chrr.osu.edu/projects/ohio-longitudinal-data-archive.
Graduates Employed in Ohio - Degree or certificate completers who were found working in Ohio two quarters following earning a degree or certificate. Degree and certificate completion are identified in HEI. The years on the graph indicate the year in which the individual earned a degree or certificate. Employment comes from UI Wage data, and includes all employees within the state of Ohio whose employers are required to file with the unemployment insurance tax system. Excludes workers outside of Ohio, Federal employees, and the self-employed. Percentages are based on the number of graduates with a unique identifier available to link to employment outcomes.
Median Annual Earnings Post-Graduation - Median earnings for graduates employed each of the four consecutive quarters beginning two quarters after earning a degree or certificate. For example, if a person graduates in spring 2011, earnings in this graph include the total of earnings for autumn 2011, winter 2012, spring 2012 and summer 2012. We report the median of all of these data points for graduates from each school year (rounded to the nearest $1000). Degree and certificate completion are identified in HEI. Wages come from UI Wage data, and include all employees within the state of Ohio whose employers are required to file with the unemployment insurance tax system. Excludes workers outside of Ohio, Federal employees, and the self-employed.
Employment Industry - For the most recent cohort we have data available, we identify the industry of the employer identified for each person who earned a degree or certificate and was found working in Ohio two quarters following completion. Degree and certificate completion are identified in HEI. Wages come from UI Wage data, and include all employees within the state of Ohio whose employers are required to file with the unemployment insurance tax system. Excludes workers outside of Ohio, Federal employees, and the self-employed. The most common industries are reported, identified by 2-digit North American Industry Classification System (NAICS) code, as reported by the employer.
Enrollment - Number of students (1) enrolled as an undergraduate, (2) enrolled as an undergraduate for the first time at a particular institution, and (3) enrolled in both high school and higher education within each school year. Enrollment is defined as enrolled in at least one course for credit. Each individual is only counted one time on each campus in each school year. However, if an individual is enrolled in courses for credit in multiple campuses, he or she will be reported at both campuses. Enrollment information is taken from HEI.
First Time as an Undergraduate - Entering students, defined as student who have no previous undergraduate credits (other than those earned during high school). Entering students are identified in HEI.
College Credit Earned in High School - Undergraduate students attending the institution who had previously earned college credit while enrolled in high school from an Ohio public college or university in or after 2000. This chart will not identify students who earned college credit from private institutions, nor will it identify students who earned college credit if they graduated from high school prior to 2000. Students who earned college credit while in high school are identified from HEI.
Students Enrolled in a Developmental Course - Entering undergraduate students, enrolled for the first time at the institution, who enroll in any developmental course in their first year. Developmental courses are identified in HEI through a course level variable, which means that additional lab or other non-credit assistance is not identified in this chart.
Fall to Fall Retention - Entering undergraduate students, enrolled for the first time at the institution in autumn, who are enrolled at the same institution the following autumn. Enrollment institution and dates are identified in HEI.
Completion in Six Years - Entering undergraduate students who earned a degree or certificate within six years. If an individual earns multiple degrees since entering, only the highest degree is recorded in this chart. Graduate degrees are not included. Student enrollment and degree/certificate dates are identified in HEI.
Race/Ethnicity - Race of undergraduate students enrolled as reported in HEI. Because race and ethnicity are reported for each term of enrollment, there are instances of conflicting information for a single student. In these cases, we use the most recently reported race and ethnicity regardless of the school year for which the data are reported. Smaller race categories such as Asian, American Indian, and Multiracial were combined to create an “other” category because small numbers would have resulted in the race categories being unreportable. Data points representing groups of less than 10 individuals are redacted to predict against re-identification.
Gender - Gender of undergraduate students enrolled as reported in HEI. Because this information is reported for each term of enrollment, there are instances of conflicting gender information for a single student. In these cases, we use the most recently reported gender regardless of the school year for which the data are reported.
Age - Age of undergraduate students enrolled as reported in HEI. Age is calculated using month and year of birth during September of the school year represented. Because birth month and year are reported for each term of enrollment, there are instances of conflicting information for a single student. In these cases, we use the most recently reported birth month and year, regardless of the school year for which the data are reported.
Employed Post-Graduation by Age - Graduates identified as employed over the four consecutive quarters beginning two quarters after earning a degree or certificate. For example, if a person graduates in spring 2011, employment in this graph include the total of earnings for autumn 2011, winter 2012, spring 2012 and summer 2012. Employment is disaggregated by age, based on the age of each individual as reported in HEI at graduation. Age is calculated using month and year of birth during September of the school year represented. Because birth month and year are reported for each quarter of enrollment, there are instances of conflicting information for a single student. In these cases, we use the most recently reported birth month and year, regardless of the school year for which the data are reported. Employment was taken from the UI Wage data.
Employed Post-Graduation by Gender - Graduates identified as employed over the four consecutive quarters beginning two quarters after earning a degree or certificate. For example, if a person graduates in spring 2011, earnings in this graph include the total of earnings for autumn 2011, winter 2012, spring 2012 and summer 2012. Employment is disaggregated by gender, based on the gender of each individual as most recently reported in HEI. Employment was taken from the UI Wage data.
Employed Post-Graduation by Race/Ethnicity - Graduates identified as employed over the four consecutive quarters beginning two quarters after earning a degree or certificate. For example, if a person graduates in spring 2011, earnings in this graph include the total of earnings for autumn 2011, winter 2012, spring 2012 and summer 2012. Employment is disaggregated by race and ethnicity, based on the race and ethnicity of each individual as most recently reported in HEI. Employment was taken from the UI Wage data.
Employed Post-Graduation by Degree - Graduates identified as employed over the four consecutive quarters beginning two quarters after earning a degree or certificate. For example, if a person graduates in spring 2011, earnings in this graph include the total of earnings for autumn 2011, winter 2012, spring 2012 and summer 2012. Employment is disaggregated by the level of degree earned by each graduate, as reported in HEI. Employment was taken from the UI Wage data.
Employed Post-Graduation by Largest Industries - Graduates identified as employed over the four consecutive quarters beginning two quarters after earning a degree or certificate. For example, if a person graduates in spring 2011, earnings in this graph include the total of earnings for autumn 2011, winter 2012, spring 2012 and summer 2012. Employment is disaggregated by industry of employment, and shown for the five most commonly-reported industries. Industry classifications are based on the two-digit North American Industry Classification System (NAICS) code reported by each individual’s primary employer in the second quarter after earning a degree or certificate. Employment was taken from the UI Wage data.
Annual Earnings Post-Graduation by Age - Median earnings for those graduates identified as employed over the four consecutive quarters beginning two quarters after earning a degree or certificate. For example, if a person graduates in spring 2011, earnings in this graph include the total of earnings for autumn 2011, winter 2012, spring 2012 and summer 2012. Earnings are disaggregated by age, based on the age of each individual as reported in HEI at graduation. Age is calculated using month and year of birth during September of the school year represented. Because birth month and year are reported for each quarter of enrollment, there are instances of conflicting information for a single student. In these cases, we use the most recently reported birth month and year, regardless of the school year for which the data are reported. Earnings were taken from the UI Wage data, and adjusted for inflation to 2010 dollars.
Annual Earnings Post-Graduation by Gender - Median earnings for those graduates identified as employed over the four consecutive quarters beginning two quarters after earning a degree or certificate. For example, if a person graduates in spring 2011, earnings in this graph include the total of earnings for autumn 2011, winter 2012, spring 2012 and summer 2012. Earnings are disaggregated by gender, based on the gender of each individual as most recently reported in HEI. Earnings were taken from the UI Wage data, and adjusted for inflation to 2010 dollars.
Annual Earnings Post-Graduation by Race/Ethnicity - Median earnings for those graduates identified as employed over the four consecutive quarters beginning two quarters after earning a degree or certificate. For example, if a person graduates in spring 2011, earnings in this graph include the total of earnings for autumn 2011, winter 2012, spring 2012 and summer 2012. Earnings are disaggregated by race and ethnicity, based on the race and ethnicity of each individual as most recently reported in HEI. Earnings were taken from the UI Wage data, and adjusted for inflation to 2010 dollars.
Annual Earnings Post-Graduation by Degree - Median earnings for those graduates identified as employed over the four consecutive quarters beginning two quarters after earning a degree or certificate. For example, if a person graduates in spring 2011, earnings in this graph include the total of earnings for autumn 2011, winter 2012, spring 2012 and summer 2012. Earnings are disaggregated by the level of degree earned by each graduate, as reported in HEI. Earnings were taken from the UI Wage data, and adjusted for inflation to 2010 dollars.
Annual Earnings Post-Graduation by Largest Industries - Median earnings for those graduates identified as employed over the four consecutive quarters beginning two quarters after earning a degree or certificate. For example, if a person graduates in spring 2011, earnings in this graph include the total of earnings for autumn 2011, winter 2012, spring 2012 and summer 2012. Earnings are disaggregated by industry of employment, and shown for the 5 most commonly-reported industries. Industry classifications are based on the 2-digit North American Industry Classification System (NAICS) code reported by each individual’s primary employer in the second quarter after earning a degree or certificate. Earnings were taken from the UI Wage data, and adjusted for inflation to 2010 dollars.
Entering Students with College Credit Earned in High School - Undergraduate students who had previously earned college credit from an Ohio public college or university while enrolled in high school. This chart does not include students who earned college credit from private institutions, nor does it include students who earned college credit in high school if they graduated from high school prior to 2000. Enrollment data, both identifying high school and undergraduate enrollment, taken from HEI.
Entering Students with College Credit Earned in High School by Gender - Undergraduate students who had previously earned college credit from an Ohio public college or university while enrolled in high school, disaggregated by gender. This chart does not include students who earned college credit from private institutions, nor does it include students who earned college credit in high school if they graduated from high school prior to 2000. Figures are disaggregated by gender, based on the gender of each individual as most recently reported in HEI.
Entering Students with College Credit Earned in High School by Race/Ethnicity - Undergraduate students who had previously earned college credit from an Ohio public college or university while enrolled in high school, disaggregated by race and ethnicity. This chart does not include students who earned college credit from private institutions, nor does it include students who earned college credit in high school if they graduated from high school prior to 2000. Figures are disaggregated by race and ethnicity, based on the race and ethnicity of each individual as most recently reported in HEI.
Largest Enrolling School Districts’ Students with College Credit - Undergraduate students who had previously earned college credit while enrolled in high school from an Ohio public college or university in or after 2000. This chart does not include students who earned college credit from private institutions, nor does it include students who earned college credit in high school if they graduated from high school prior to 2000. The districts represent the five Ohio school districts enrolling the largest number of students at the post-secondary institution. School district, as well as enrollment information, is reported through HEI.
Students Enrolling with College Credit Granted by Institution - Students who had earned college credit from this post-secondary institution while in high school who then enrolled as an undergraduate at this same institution within one year of high school graduation. School district, as well as enrollment information, is reported through HEI.
Year One Retention of Fall Enrollees - Students first enrolling in an undergraduate program in the fall who are still enrolled at any Ohio public post-secondary institution in the spring term, and/or are enrolled the following fall term. Students are identified as enrolled in a particular term if they appear in the HEI enrollment table.
Year One Course Success - The mean number or percentage of credits earned in the first year enrolled in the undergraduate program for those students who first enrolled in the undergraduate program in the fall. Course credit enrollment and success are identified using HEI course data.
Students Earning At Least 24 Credits in Year One - Undergraduate students who earn at least 24 credits in the first full school year enrolled in the undergraduate program. Course credit enrollment and success are identified using HEI course data.
Students Earning Associate’s or Certificate in Four Years or Less - Students who earned a certificate or associate’s degree within four years of first undergraduate enrollment at the higher education institution. This table represents students earning a degree or certificate from any Ohio public higher education institution, as identified in HEI.
Students Earning Bachelor’s in Six Years or Less - Students who earned a degree within six years of first undergraduate enrollment at the higher education institution. This table represents students earning a degree from any Ohio public higher education institution, as identified in HEI.
Developmental Courses Taken and Passed - Total number of developmental courses taken by all undergraduate students enrolled for the first time at the institution, during their first year. Developmental courses are identified in HEI through a course-level variable, which means that additional lab or other non-credit assistance will not be identified in this chart. The chart includes both the total number of developmental courses taken and the number and percent of courses taken for which the student earned credit.
Developmental Courses Taken and Passed by Student - This graph identifies “Courses per Student,” which is the average number of developmental courses taken by all newly-enrolled undergraduate students during their first year. This graph also identifies the number of courses for which the outcome was a passing grade. Developmental courses are identified in HEI through a course-level variable, which means that additional lab or other non-credit assistance will not be identified in this chart.
Developmental Courses Taken By Subject - Developmental courses taken by all undergraduate students enrolled for the first time at the institution, during their first year. Developmental courses are identified in HEI through a course-level variable, which means that additional lab or other non-credit assistance will not be identified in this chart. The figures on this graph represent courses disaggregated by course subject area as reported in HEI.
Developmental Course Success By Subject - Total number of developmental courses taken by all undergraduate students enrolled for the first time at the institution, during their first year, for which a student earned credit. Developmental courses are identified in HEI through a course-level variable, which means that additional lab or other non-credit assistance will not be identified in this chart. The figures on this graph represent courses disaggregated by course subject area as reported in HEI.
Students Enrolled in Developmental Course(s) by Largest Enrolling Districts - This graph represents undergraduate students who are enrolled in developmental courses during their first year who graduate from the five school districts with the largest enrollment at the post-secondary institution. School district, as well as enrollment information, is reported through HEI.
Enrollment by Age - Enrollment by students enrolled as an undergraduate, disaggregated by age group. Enrollment is defined as enrolled in at least one course for credit. Each individual is only counted one time on each campus in each school year. However, if an individual is enrolled in courses for credit in multiple campuses, he or she will be reported in both campuses. Age is calculated based on month and year of birth, as most recently reported in HEI, in September of the reported school year.
Enrollment by Gender - Students enrolled as an undergraduate, disaggregated by gender. Enrollment is defined as enrolled in at least one course for credit. Each individual is only counted one time on each campus in each school year. However, if an individual is enrolled in courses for credit in multiple campuses, he or she will be reported in both campuses. Figures are disaggregated by gender, based on the gender of each individual as most recently reported in HEI.
Enrollment by Race/Ethnicity - Students enrolled as an undergraduate, disaggregated by race and ethnicity. Enrollment is defined as enrolled in at least one course for credit. Each individual is only counted one time on each campus in each school year. However, if an individual is enrolled in courses for credit in multiple campuses, he or she will be reported in both campuses. Figures are disaggregated by race and ethnicity, based on the race and ethnicity of each individual as most recently reported in HEI.
International Student Enrollment - Students enrolled as undergraduates who are international students. Enrollment is defined as enrolled in at least one course for credit. Each individual is only counted one time on each campus in each school year. However, if an individual is enrolled in courses for credit in multiple campuses, he or she will be reported in both campuses. Students are identified as international if they are identified as “nonresident alien” in HEI.
High School Student Enrollment by Race/Ethnicity - High school students enrolled, disaggregated by race and ethnicity. Enrollment is defined as enrolled in at least one course for credit. Each individual is only counted one time on each campus in each school year. However, if an individual is enrolled in courses for credit in multiple campuses, he or she will be reported in both campuses. Figures are disaggregated by race and ethnicity, based on the race and ethnicity of each individual as most recently reported in HEI.